Magpie Dashboards

Context & Challenges
The product. Magpie Literacy is a K-8 reading application. Embedded in it are the Magpie Dashboards: Usage, Completion, and ROAR Assessments reporting for teachers, school admins, and district admins. Educators use them to monitor engagement, track curriculum progress, and act on assessment results.
My role. I joined in January 2026 as Principal Product Manager, owning Platform Data: the team behind internal analytics and the customer-facing dashboards.
The situation. A young product on a brittle foundation, a team only weeks old, and a company expanding from K-2 to K-8. The work: rebuild the foundation, restore trust, and grow the product, all at once, without abandoning the educators depending on it.
Problems
Partners were losing trust.
Bugs and unkept promises from the year prior had eroded confidence, and school admin completion data was significantly inflated across partners. Inaccurate dashboards were worse than no dashboards.
Metrics had no shared meaning.
Research and Product could pull different numbers for the same concept, with no governance to reconcile them.
The foundation couldn't hold.
A monolithic, fragmented ETL with tightly coupled schemas created high engineering overhead, data inconsistencies, and slow iteration. It could not scale to projected user growth or a K-8 product.
Research was doing the dashboards' job.
Research absorbed the shortfall with costly manual reports, pulling researchers off efficacy work and cannibalizing the dashboards' reason to exist.
We were flying blind.
No usage instrumentation, no SLIs or SLOs, no QA fit for data-heavy surfaces, and a weeks-old team with sparse documentation and knowledge held by individuals.
Educators weren't getting the value.
Dashboards weren't used to fidelity as an instructional tool, discovery hadn't grounded the roadmap in educator pain, and there was no designer or realistic environment to design and test improvements in

Planning & Process
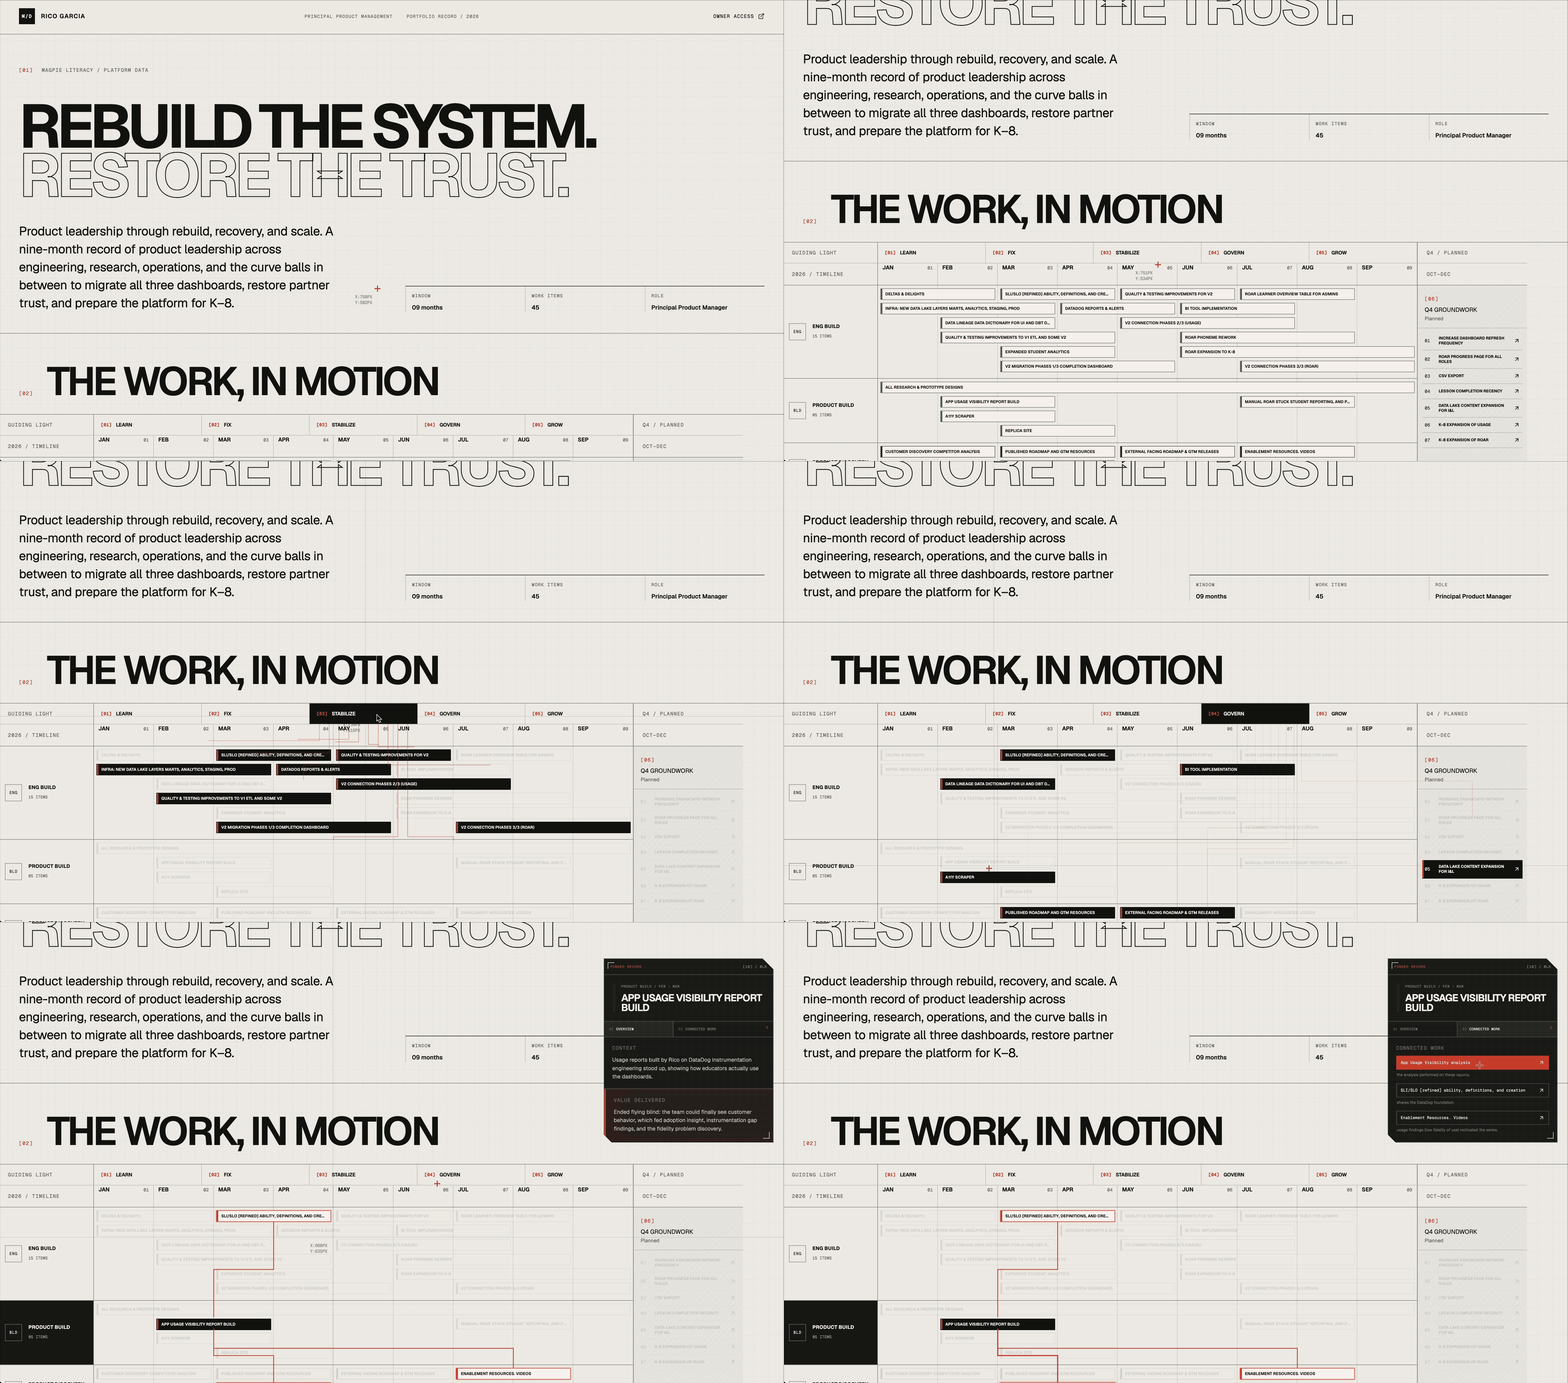
If only it was as simple as a few sentences...click the link to explore a detailed process with artifacts!
Solution & Results

Rebuilt the foundation
Established the V2 data infrastructure: dbt with CI/CD and observable orchestration, a governed dimensional layer, and a materialized mart pattern loading curated outputs from the data lake into Postgres. Version-controlled, testable, observable, reusable.
Rebuilt trust, deliberately
Chose rebuild over repair: a controlled, time-boxed blackout of the Completion Dashboard, relaunched from the data lake with no reported bugs. The blackout became the model, so the Usage and ROAR migrations that followed could move faster.

Gave research back to research
Made metrics mean one thing. Cross-functional data governance with research and academics, dbt docs and lineage as the source of truth, and shared definitions across Product and Research; returning that capacity to efficacy research.
Turned the lights on
Stood up usage reporting via DataDog, defined SLIs and SLOs with alerting, took on dashboard QA directly, and built the documentation the team lacked, including the first frontend data dictionary covering lineage and calculations.



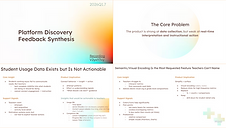
Put educators at the center
Ran discovery through interviews, surveys, classroom observations, and competitor analysis. Built a data-rich replica site to design and prototype without a committed designer. Produced a nine-video educator demo series to drive dashboard use as an instructional tool.
